|
|
|
To: 8.2.6 Effects of cut-off circulation |
In this section we compare our computed drag force on the cylinder to that obtained in the boundary layer computations of Van Dommelen & Shankar (unpublished); to analytical solutions for small times derived by Collins & Dennis [60]; and to other numerical computations [3,40,117,120,133,170,237,249].
The force on the cylinder per unit length, nondimensionalized by
![]() , is most accurately computed using the equation
derived by Graham [94],
, is most accurately computed using the equation
derived by Graham [94],
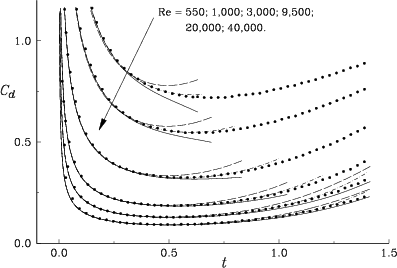 |
Figure 8.24 shows the drag force at early times
for Reynolds numbers in the range ![]() to
to ![]() according to our numerical results and according to analytical results.
The first of the analytical results are the boundary
layer computations of Van Dommelen & Shankar (unpublished)
that are valid for sufficiently small times or for sufficiently
high Reynolds numbers. The broken and solid boundary layer curves
in figure 8.24 correspond to different levels of
approximation, the solid curve being the more accurate, and we
have terminated the curves where significant differences between
the two start to show up.
according to our numerical results and according to analytical results.
The first of the analytical results are the boundary
layer computations of Van Dommelen & Shankar (unpublished)
that are valid for sufficiently small times or for sufficiently
high Reynolds numbers. The broken and solid boundary layer curves
in figure 8.24 correspond to different levels of
approximation, the solid curve being the more accurate, and we
have terminated the curves where significant differences between
the two start to show up.
The other analytical results are due to Collins & Dennis
[60] and were obtained from expanding the solution
analytically in powers of time, leading to ordinary differential
equations that are then solved numerically. The expansions were
taken as high as sixth order in time and figure 8.24
shows that they remain accurate until quite late. We conjecture
that infinite Reynolds number the region of convergence may be
as large as up to time ![]() , at which time the exact solution
has a singularity (the Van Dommelen & Shen singularity
[241]).
Note for the highest Reynolds number that near
, at which time the exact solution
has a singularity (the Van Dommelen & Shen singularity
[241]).
Note for the highest Reynolds number that near ![]() the results
of Collins & Dennis [60] move away from
the solid boundary layer curve. Yet, the small difference between the
two boundary layer curves, as well as our own data indicate that the solid
curve is accurate; it is a higher order approximation than the standard
boundary layer curve.
the results
of Collins & Dennis [60] move away from
the solid boundary layer curve. Yet, the small difference between the
two boundary layer curves, as well as our own data indicate that the solid
curve is accurate; it is a higher order approximation than the standard
boundary layer curve.
We note that as long as the boundary layer solution is certainly accurate, as indicated by coinciding curves, it also coincides with the results of Collins & Dennis [60] as well as with our numerical data. This is strong support for our results.
All our computations reproduce the singularity in the drag at vanishing time very well. At those early times, half the drag is due to the singular wall shear caused by the vanishingly thin boundary layer while the other half is due to the pressure forces induced by the strong outward diffusion of the boundary layer vorticity, see Van Dommelen & Shankar [229] for a detailed discussion. It is gratifying to see how well our computation reproduces this, even though at the initial time step, our computation approximates the entire boundary layer by a single string of vortices (section 6.3).
Also note that according to the small time expansion, the exact solution is in between the two boundary layer curves when they start to diverge. This agrees well with our computation. It should be expected that the correct solution follows the expansion of Collins & Dennis [60] until their small time assumption breaks down, and our computation does exactly that. Also, note that for higher Reynolds numbers and larger times, when the boundary layer theory is presumably more accurate, our results start following that. Altogether, the analytical solutions provide solid support for the correctness and accuracy of our computation at the times that the analytical data are valid.
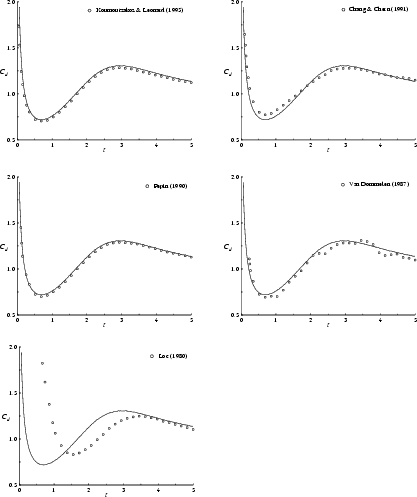 |
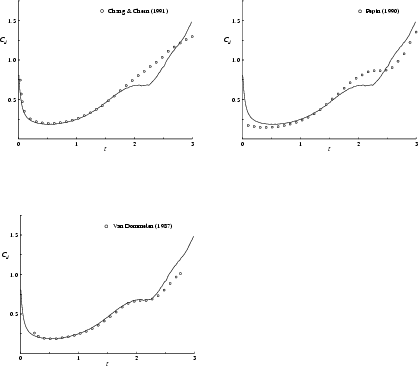
For longer times than can be described by theory,
we will compare our computed drag force
with other computational results.
First, for ![]() , our computed drag is in excellent agreement with
that of Koumoutsakos & Leonard [117]
and Pépin [170];
see figure 8.25.
, our computed drag is in excellent agreement with
that of Koumoutsakos & Leonard [117]
and Pépin [170];
see figure 8.25.
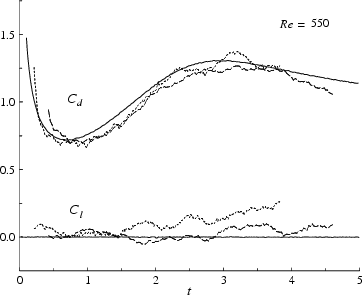 |
It is also in fair agreement with the finite difference results of Chang & Chern [40] and with the random walk computation of Van Dommelen [237]. In figure 8.26, we show two different random walk curves obtained by Van Dommelen (different random numbers). The difference between the curves verifies that the errors in the random walk method are responsible for the deviations from our much more accurate results. We do not agree with Loc's [133] results, figure 8.25. Loc's data are also in clear violation of the analytical data of figure 8.24. Further, the close agreement between the best three computations in figure 8.25 provides strong support that our computation remains accurate beyond the times for which the theories apply.
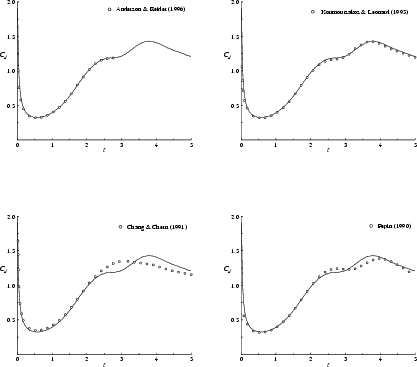 |
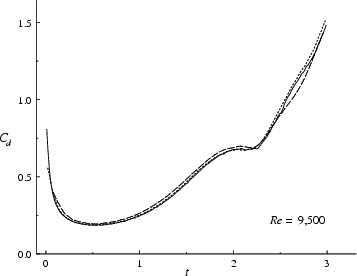
The accuracy of our computed drag is further validated at Reynolds number
![]() in figure 8.27 by the excellent agreement
with high resolution computations of
Anderson & Reider [3]
and Koumoutsakos & Leonard [117].
in figure 8.27 by the excellent agreement
with high resolution computations of
Anderson & Reider [3]
and Koumoutsakos & Leonard [117].
 |
 |
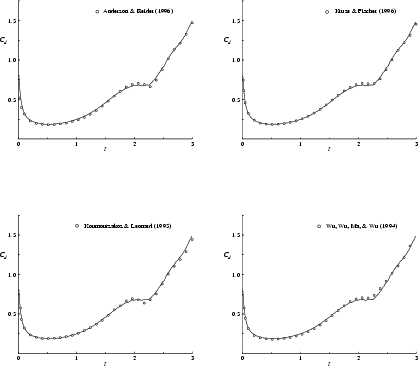
At Reynolds number ![]() , our results are further validated by
excellent agreement with those of
Kruse & Fischer [120], Koumoutsakos & Leonard
[117],
Wu, Wu, Ma & Wu [249] and
Anderson & Reider [3]; see figure 8.28.
Note however, that there are some minor discrepancies between these
computations at the drag ``plateau" near time
, our results are further validated by
excellent agreement with those of
Kruse & Fischer [120], Koumoutsakos & Leonard
[117],
Wu, Wu, Ma & Wu [249] and
Anderson & Reider [3]; see figure 8.28.
Note however, that there are some minor discrepancies between these
computations at the drag ``plateau" near time ![]() . We again tend to
believe that our results are the most accurate of all, despite the fact
that we use much less computational points as the other computations.
. We again tend to
believe that our results are the most accurate of all, despite the fact
that we use much less computational points as the other computations.
 |
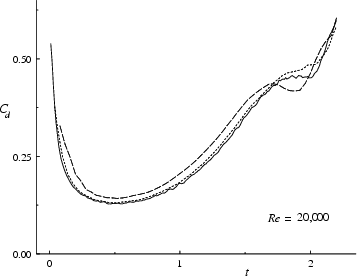
One reason is the apparent computational convergence with numerical resolution shown in figure 8.29. Another reason is that the results of Kruse & Fischer [120], a spectral element computation with over a million nodal points, do not show the ``dip" in the drag experienced by Koumoutsakos & Leonard [117] and Anderson & Reider [3]. See subsections 8.2.6 and 8.2.9 for additional arguments.
 |
In the next section we will explain a difficulty in this type of computations that has not been paid much attention to so far. It may explain some of the difficulties previous computations have experienced.